Automation Coverage Report
The Automation Coverage report tracks the automation status of test cases to measure automation progress, identify manual testing gaps, and prioritize automation efforts. This report is essential for planning automation roadmaps, justifying automation investments, and tracking automation initiatives.
What This Report Shows
The Automation Coverage report displays:
- Overall Automation Coverage: Pie chart showing the percentage of test cases by automation status
- Automation Status Breakdown: Count and percentage of Automated, In Progress, Planned, and unassigned test cases
- Coverage by Section: Automation coverage for different sections/folders of your test suite
- Not Automated Metrics: Count and percentage of tests not yet automated per section
When to Use This Report
Use the Automation Coverage report when you need to:
- Track automation progress against goals and targets
- Plan automation roadmap by identifying high-value manual tests
- Justify automation investments with data on current manual testing effort
- Identify automation gaps in critical features or workflows
- Measure ROI of automation initiatives over time
- Communicate automation status to stakeholders
- Prioritize automation work based on test frequency, duration, and criticality
Prerequisites
This report requires the Automation custom field to be enabled in your project. To enable it:
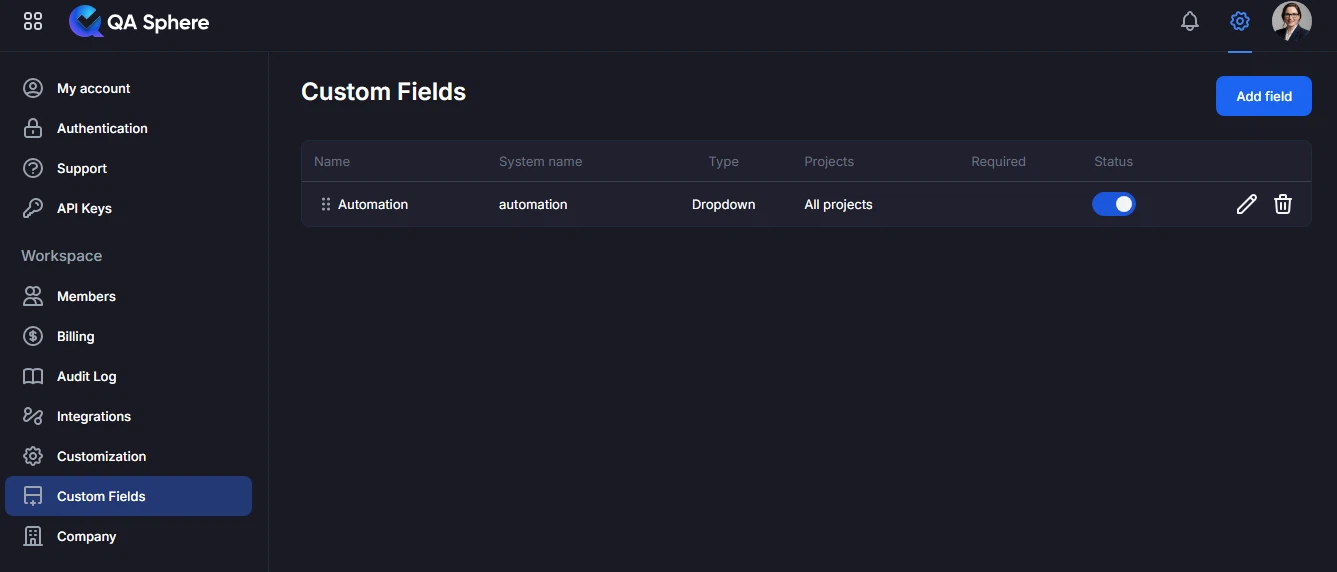
- Navigate to Settings → Custom Fields
- Locate the Automation field
- Ensure it is enabled for your project
Once enabled, you can assign one of the following automation statuses to each test case:
- Automated — Test case is fully automated
- In Progress — Automation is currently being developed
- Planned — Test case is scheduled for automation
- Cannot be Automated — Test case is not suitable for automation
- Broken — Automated test is currently broken and needs fixing
The report will display coverage based on these values.
Test cases without an automation status assigned will appear as "(No Value)" in the report.
Understanding the Report
Automation Coverage Summary
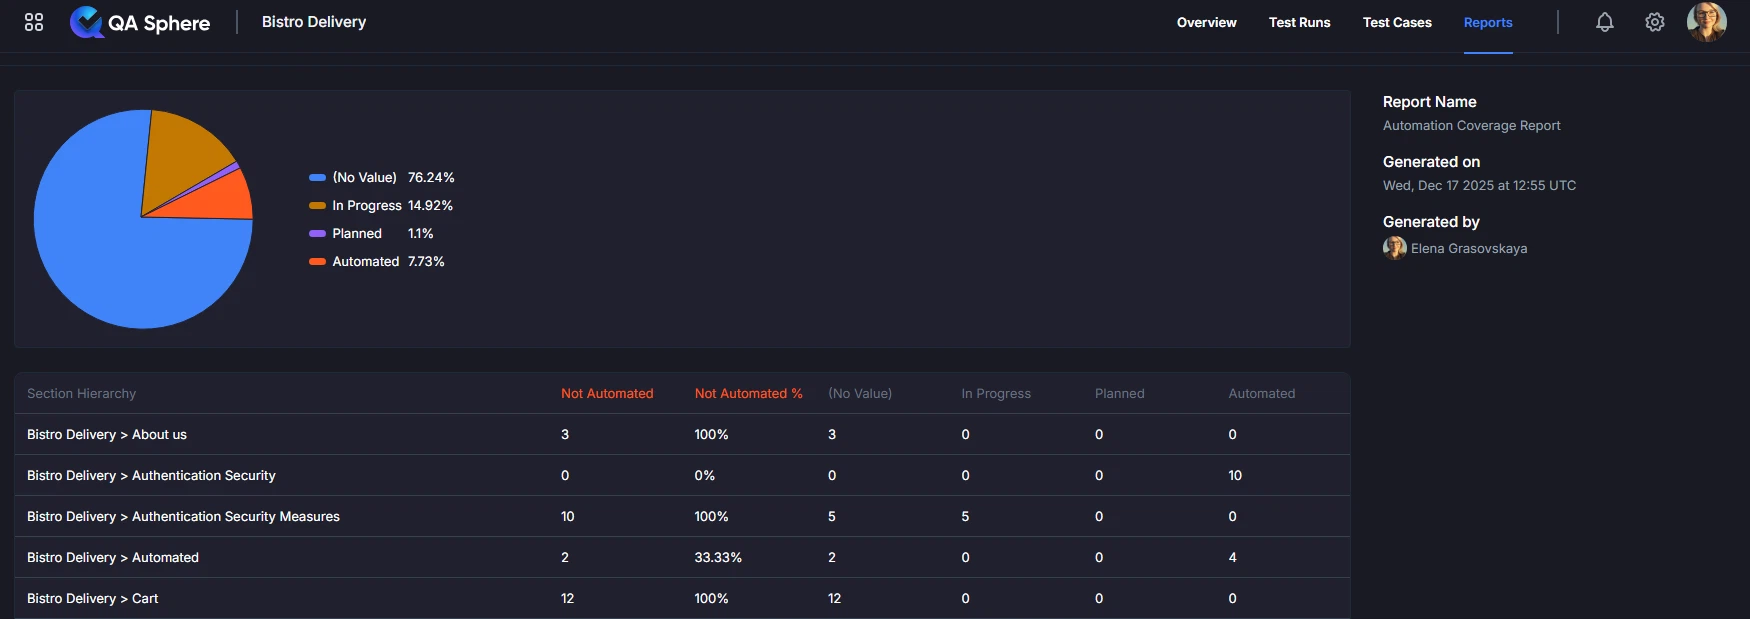
At the top of the report, you'll see a pie chart with overall automation metrics showing the distribution of test cases by automation status.
Automation Status Categories
Automated:
- Test cases that are fully automated
- Execute without manual intervention
- Included in CI/CD pipelines
In Progress:
- Test cases where automation is currently being developed
- Transitional state between manual and automated
Planned:
- Test cases identified for future automation
- Scheduled for automation but not yet started
Cannot be Automated:
- Test cases that are not suitable for automation
- Examples: exploratory testing, usability testing, manual verification
Broken:
- Automated tests that are currently failing due to test issues
- Require maintenance or fixing before they can be used reliably
(No Value):
- Test cases without an automation status assigned
- May require review to determine automation feasibility
Coverage by Section
The table provides a detailed breakdown showing automation status by section hierarchy:
| Column | Description |
|---|---|
| Section Hierarchy | The folder path in your test case structure |
| Not Automated | Count of test cases not yet automated |
| Not Automated % | Percentage of test cases not automated in this section |
| (No Value) | Test cases without automation status assigned |
| In Progress | Test cases with automation in development |
| Planned | Test cases scheduled for automation |
| Automated | Test cases that are fully automated |
Example report:
| Section Hierarchy | Not Automated | Not Automated % | (No Value) | In Progress | Planned | Automated |
|---|---|---|---|---|---|---|
| Bistro Delivery > About us | 3 | 100% | 3 | 0 | 0 | 0 |
| Bistro Delivery > Authentication Security | 0 | 0% | 0 | 0 | 0 | 10 |
| Bistro Delivery > Authentication Security Measures | 10 | 100% | 5 | 0 | 0 | 0 |
| Bistro Delivery > Automated | 2 | 33.33% | 2 | 0 | 0 | 4 |
| Bistro Delivery > Cart | 12 | 100% | 12 | 0 | 0 | 0 |
Insights from Example:
- Authentication Security section has 100% automation (10 automated tests)
- Automated section has 33.33% not automated (4 automated, 2 without status)
- About us, Authentication Security Measures, and Cart sections need automation attention (100% not automated)
Generating the Report
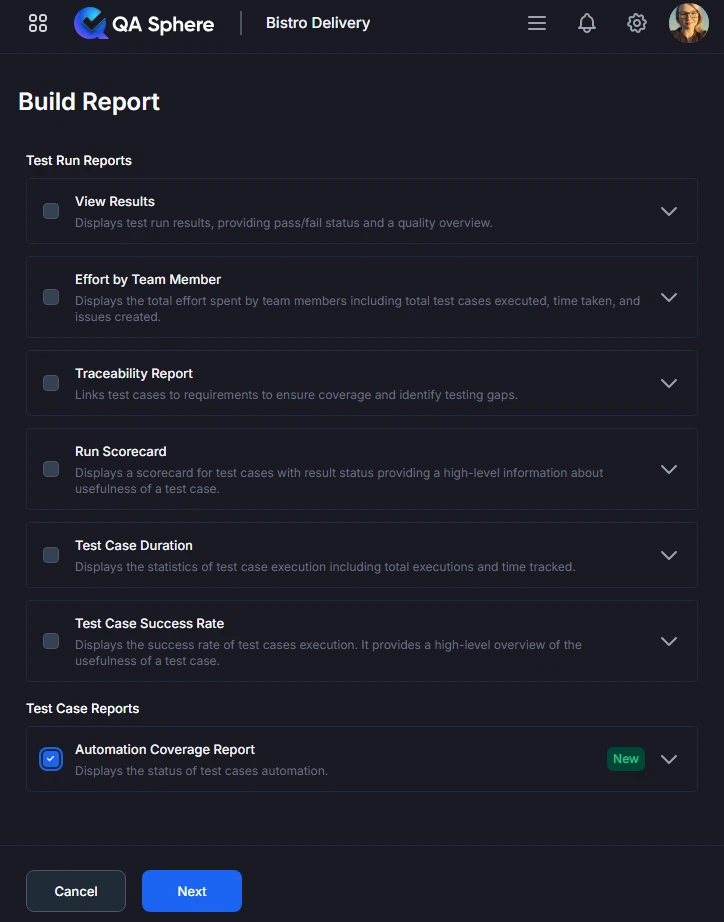
- Open your QA Sphere project
- Click Reports in the top navigation
- Select Automation Coverage
- Click Next
- Choose the folders to include in the report
- Click Build report
Export Options
Export XLSX:
- Raw data export for further analysis
- Open in Excel, Google Sheets, or BI tools
- Click ... and then Export XLSX button
Export PDF:
- Full report with charts and tables
- Professional formatting for stakeholder distribution
- Click ... and then Export PDF button
Print:
- Direct print for physical documentation
- Formatted for standard paper sizes
- Click ... and then Print button
Interpreting Results
Strong Automation Coverage
Total: 500 test cases
Automated: 425 (85%)
Manual: 50 (10%)
Pending: 25 (5%)

By Area:
Core Features: 95% automated
Integration Tests: 80% automated
UI Tests: 75% automated
API Tests: 90% automated
Interpretation: Excellent automation coverage with most areas well-automated. The 10% manual testing is likely exploratory or edge cases.
Action: Maintain current automation, focus on completing pending 5%.
Moderate Automation Coverage
Total: 500 test cases
Automated: 300 (60%)
Manual: 175 (35%)
Pending: 25 (5%)

By Area:
Core Features: 80% automated
Integration Tests: 50% automated
UI Tests: 40% automated
API Tests: 85% automated
Interpretation: Moderate coverage with significant manual testing remaining. UI tests are underautomated.
Action: Prioritize UI test automation, particularly for high-frequency tests.
Poor Automation Coverage
Total: 500 test cases
Automated: 150 (30%)
Manual: 325 (65%)
Pending: 25 (5%)

By Area:
Core Features: 45% automated
Integration Tests: 25% automated
UI Tests: 15% automated
API Tests: 60% automated
Interpretation: Low automation coverage requires significant investment. Most testing is manual, consuming substantial resources.
Action: Urgent automation initiative needed. Start with high-ROI tests (frequent, time-consuming, stable).
Best Practices
1. Set Realistic Automation Targets
Industry Benchmarks:
- Good: 70-80% automation coverage
- Excellent: 80-90% automation coverage
- Exceptional: 90%+ automation coverage
Not All Tests Should Be Automated:
- Exploratory testing: Manual
- Usability testing: Manual
- One-time tests: Manual (low ROI)
- Rapidly changing features: Manual (until stabilized)
Example Target:
Realistic Goal: 75% automation coverage
- 75% fully automated (high-frequency, stable tests)
- 15% manual (exploratory, usability, edge cases)
- 10% pending/not applicable
2. Prioritize by ROI
High ROI Automation:
✓ Regression tests (run frequently)
✓ Time-consuming manual tests
✓ Stable, well-defined tests
✓ Critical business workflows
✓ Cross-browser/device tests
Low ROI Automation:
✗ One-time or rarely run tests
✗ Tests that change frequently
✗ Tests requiring complex setup
✗ Exploratory or creative testing
ROI Calculation Formula:
ROI Score = (Test Frequency × Manual Execution Time �× Stability) / Automation Effort
Example:
Test A: (52 runs/year × 15 min × 0.9 stability) / 2 hours effort = 351 points
Test B: (4 runs/year × 5 min × 0.6 stability) / 4 hours effort = 3 points
Priority: Automate Test A first
3. Track Automation Velocity
Measure Progress:
- Tests automated per sprint
- Automation coverage increase per quarter
- Time from test creation to automation
Example Metrics:
Sprint Velocity:
Sprint 20: +8 automated tests
Sprint 21: +12 automated tests
Sprint 22: +10 automated tests
Average: 10 tests/sprint

Quarterly Progress:
Q1: 60% → 65% (+5%)
Q2: 65% → 72% (+7%)
Q3: 72% → 80% (+8%)
Trend: Accelerating ✅
4. Prevent Manual Test Backlog Growth
Challenge: New manual tests added faster than automation
Solution:
Policy: Automate-First Approach
- New features must include automated tests
- Manual tests only for exploratory/usability
- Automate within same sprint as test creation
- Track "automation debt" like technical debt

Metric to Track:
Manual Test Growth Rate vs Automation Rate
Good: Automation Rate > Manual Growth Rate
Bad: Manual tests accumulating faster than automation
5. Celebrate Automation Milestones
Team Recognition:
- 70% coverage milestone: Team lunch
- 80% coverage milestone: Team outing
- Individual contributors: Recognition in team meetings
Business Communication:
- Quarterly automation reports to leadership
- Highlight time/cost savings
- Show impact on release velocity
Example Communication:
Q2 Automation Success:
✅ Increased coverage from 65% to 72%
✅ Automated 42 high-priority tests
✅ Reduced regression testing time by 30%
✅ Saved estimated 300 manual testing hours
✅ Improved release confidence

Team Recognition: Thank you to Alice, Bob, and Carol!
6. Maintain Automated Tests
Automation Isn't "Set and Forget":
- Automated tests require maintenance
- Budget 15-20% of time for test updates
- Monitor automated test reliability
- Refactor brittle or flaky tests
Maintenance Metrics:
Healthy Automation:
- <5% tests failing due to test issues (not real bugs)
- <10% tests requiring updates per sprint
- >95% test reliability

Warning Signs:
- >15% tests frequently failing
- >25% tests requiring constant updates
- Flaky tests quarantined from CI/CD
Related Reports
- Test Case Duration: Identify time-consuming manual tests worth automating
- Test Case Success Rate: Find stable tests good for automation
- View Results: See impact of automation on testing efficiency
Getting Help
For assistance with this report:
- Verify test cases have automation status set
- Check the Reports Overview for general guidance
- Review automation status categories and definitions
- Contact QA Sphere support: [email protected]
Quick Summary: The Automation Coverage report tracks your automation progress. Set realistic targets (70-80% coverage), prioritize high-ROI tests, track velocity, and maintain your automated tests. Use for roadmap planning, justifying investments, and celebrating milestones. Remember: not all tests should be automated.