Test Case Duration Report (Test Case Duration Analysis)
The Test Case Duration report analyzes test execution times to help you identify slow tests, optimize test suites, and improve CI/CD pipeline performance. This report is essential for maintaining efficient testing processes and reducing feedback loops.
What This Report Shows
The Test Case Duration report displays:
- Summary Metrics: Average, minimum, and maximum execution times
- Test Case Duration Details: Individual test execution times and counts
- Duration Trends: Execution time patterns across multiple runs
- Folder Organization: Test cases grouped by folder for focused analysis
- Execution Frequency: How many times each test has been executed
When to Use This Report
Use the Test Case Duration report when you need to:
- Optimize CI/CD pipelines by identifying and improving slow tests
- Reduce test execution time to provide faster feedback
- Identify performance regressions in test execution
- Plan test parallelization by understanding test duration distribution
- Estimate testing effort for sprint or release planning
- Balance test suites for efficient resource utilization
Understanding the Report
Summary Metrics
At the top of the report, you'll see three key duration metrics:
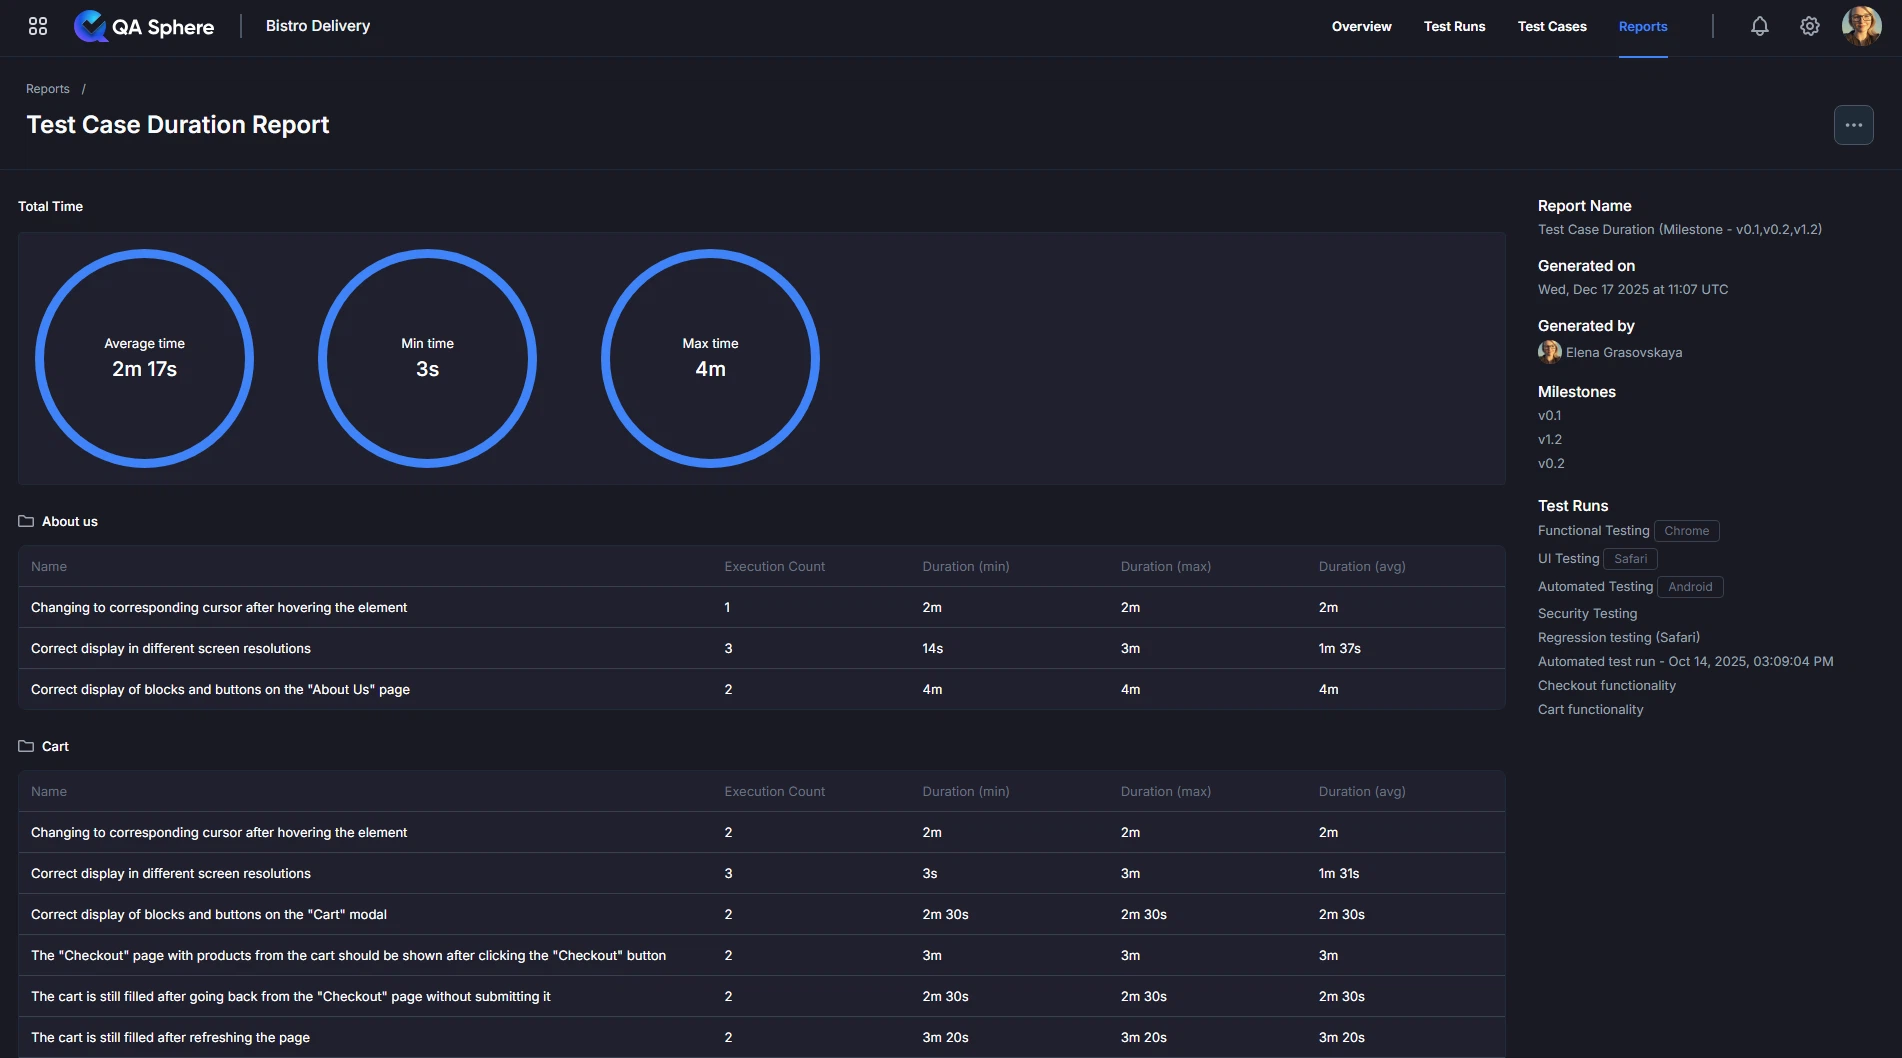
Summary Circles Display:
- Average Time: Mean execution time across all tests
- Min Time: Fastest test execution time
- Max Time: Slowest test execution time
Example Summary:
Average time: 2m 24s
Min time: 1m 20s
Max time: 4m
Interpretation:
- Average (2m 24s): Typical test takes ~2.5 minutes
- Min (1m 20s): Fastest test is relatively quick
- Max (4m): Slowest test takes nearly twice the average - candidate for optimization
Duration Table
Below the summary, you'll find detailed test case information:
| Column | Description |
|---|---|
| Name | Test case name and description |
| Execution Count | Number of times test has been executed |
| Duration (min) | Fastest execution time |
| Duration (max) | Slowest execution time |
| Duration (avg) | Average execution time |
Example Table:
Name                                             Count  Min     Max     Avg
Correct display of blocks and buttons in navbar    1    2m 40s  2m 40s  2m 40s
User should see "About Us" page after clicking     1    1m 20s  1m 20s  1m 20s
User should see "Today's Menu" block               1    1m 30s  1m 30s  1m 30s
Changing to corresponding cursor...                1    2m      2m      2m
Correct display in different screen resolutions    1    3m      3m      3m
Folder Organization
Tests are organized by folder structure:
📁 Navbar
  └─ Test 1: 2m 40s (avg)
  └─ Test 2: 1m 20s (avg)

📁 About us
  └─ Test 3: 1m 30s (avg)

📁 Checkout
  └─ Test 4: 3m (avg)
  └─ Test 5: 2m (avg)
Folder Insights:
- Total folder time: Sum of all test durations in folder
- Folder average: Mean duration for folder tests
- Slowest tests: Identify optimization candidates per folder
Generating the Report
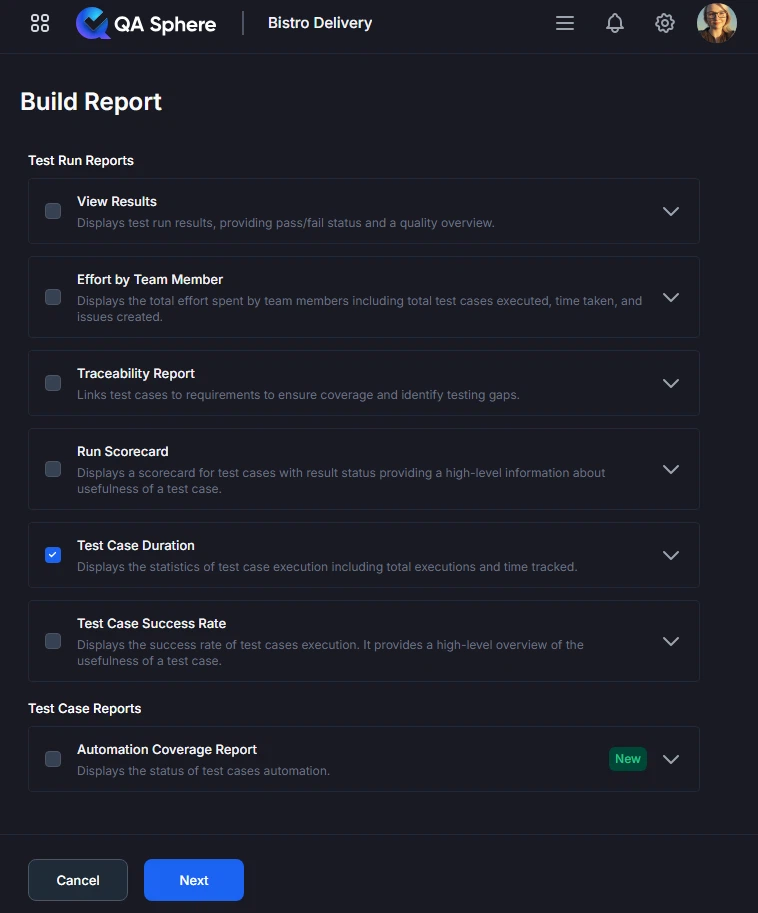
- Open your QA Sphere project
- Click Reports in the top navigation
- Select Test Case Duration
- Click Next
- Choose the way to select test cases for the report: by Milestone, Test Run or time Period
- Click Build report
Export Options
Export XLSX:
- Raw data export for further analysis
- Open in Excel, Google Sheets, or BI tools
- Click ... and then Export XLSX button
Export PDF:
- Full report with charts and tables
- Professional formatting for stakeholder distribution
- Click ... and then Export PDF button
Print:
- Direct print for physical documentation
- Formatted for standard paper sizes
- Click ... and then Print button
Best Practices
1. Track Duration Trends
Establish Baselines:
Baseline (Sprint 20):
- Average: 2m 30s
- Total suite: 45m
- Slowest test: 5m
Monitor Changes:
Sprint 21:
- Average: 2m 45s (+15s) ⚠️
- Total suite: 48m (+3m) ⚠️
- Slowest test: 6m (+1m) ⚠️
Trend: Degrading - investigate!
Set Alerts:
- Alert if average > 3m
- Alert if total suite > 60m
- Alert if any test > 10m
- Alert if variance > 50%
2. Optimize High-Impact Tests
Use the 80/20 Rule:
- 20% of tests typically consume 80% of time
- Focus optimization on slowest 20%
- Biggest ROI from optimizing slow tests
3. Set Duration Targets
Establish Standards:
Fast Tests (Target: < 30s):
- Unit tests
- Simple integration tests
- API tests
- Smoke tests
Medium Tests (Target: 30s - 3m):
- UI integration tests
- Database integration tests
- Multi-step workflows
Slow Tests (Target: 3m - 10m):
- Complex E2E scenarios
- Cross-system integration
- Performance tests
Too Slow (> 10m):
- Needs optimization or restructuring
- Consider splitting into multiple tests
- May need architectural changes
Example Policy:
Unit Tests:    Must be < 10s
API Tests:     Must be < 30s
UI Tests:      Must be < 5m
E2E Tests:     Must be < 10m
Total Suite:   Must be < 1h
4. Regular Duration Reviews
Review Cadence:
- Daily: Check if any tests exceeded thresholds
- Weekly: Review trend in average duration
- Sprint: Comprehensive duration analysis
- Quarterly: Major optimization initiative
Review Checklist:
- Average duration stable or improving
- No tests exceed maximum thresholds
- Variance is acceptable (< 50%)
- Total suite time within budget
- New tests follow duration standards
5. Document Performance Requirements
Include in Test Design:
Test Case: User Registration
Expected Duration: 2 minutes ± 30s
Maximum Allowed: 3 minutes
Performance Requirements:
- Page load < 2s
- API calls < 500ms
- Database queries < 100ms
Benefits:
- Sets clear expectations
- Enables performance regression detection
- Guides test optimization efforts
6. Balance Speed and Thoroughness
Don't Sacrifice Quality for Speed:
- Faster isn't always better
- Some tests legitimately need time
- Important: Accurate > Fast
When Long Duration is OK:
- Complex multi-step workflows
- Necessary wait times (email delivery, processing)
- Comprehensive integration scenarios
- Performance/load tests
When to Optimize:
- Unnecessary waits
- Redundant operations
- Inefficient test design
- Can be faster without compromising accuracy
Related Reports
- Test Runs Scorecard Analysis: Compare duration across multiple test runs
- Test Case Success Rate Analysis: Correlate duration with flakiness
- Testing Effort Analysis: Total time spent on testing activities
Getting Help
For assistance with this report:
- Verify test runs include duration data
- Check the Reports Overview for general guidance
- Review test framework configuration for duration tracking
- Contact QA Sphere support: [email protected]
Quick Summary: The Test Case Duration report helps you optimize testing speed. Focus on the slowest 20% of tests for maximum impact. Track duration trends to detect regressions early. Balance test suite for efficient parallelization. Set and enforce duration standards to maintain fast feedback loops.