Test Case Success Rate Report (Test Case Success Rate Analysis)
The Test Case Success Rate report calculates success rates for individual test cases across multiple executions to identify unreliable tests, track test quality, and prioritize test maintenance efforts. This report is essential for maintaining a reliable and trustworthy test suite.
What This Report Shows
The Test Case Success Rate report displays:
- Overall Success Rate: Aggregate success percentage across all test cases
- Per-Test Success Rates: Individual success percentages for each test case
- Execution Counts: Number of times each test has been executed
- Reliability Metrics: Statistical significance of success rates
- Folder Organization: Tests grouped by folder structure
When to Use This Report
Use the Test Case Success Rate report when you need to:
- Identify flaky tests that pass/fail inconsistently
- Track test reliability across multiple executions
- Prioritize test maintenance based on failure frequency
- Evaluate test quality before expanding test suite
- Build confidence in test results through consistency metrics
- Quarantine unreliable tests from critical pipelines
Understanding the Report
Overall Success Rate
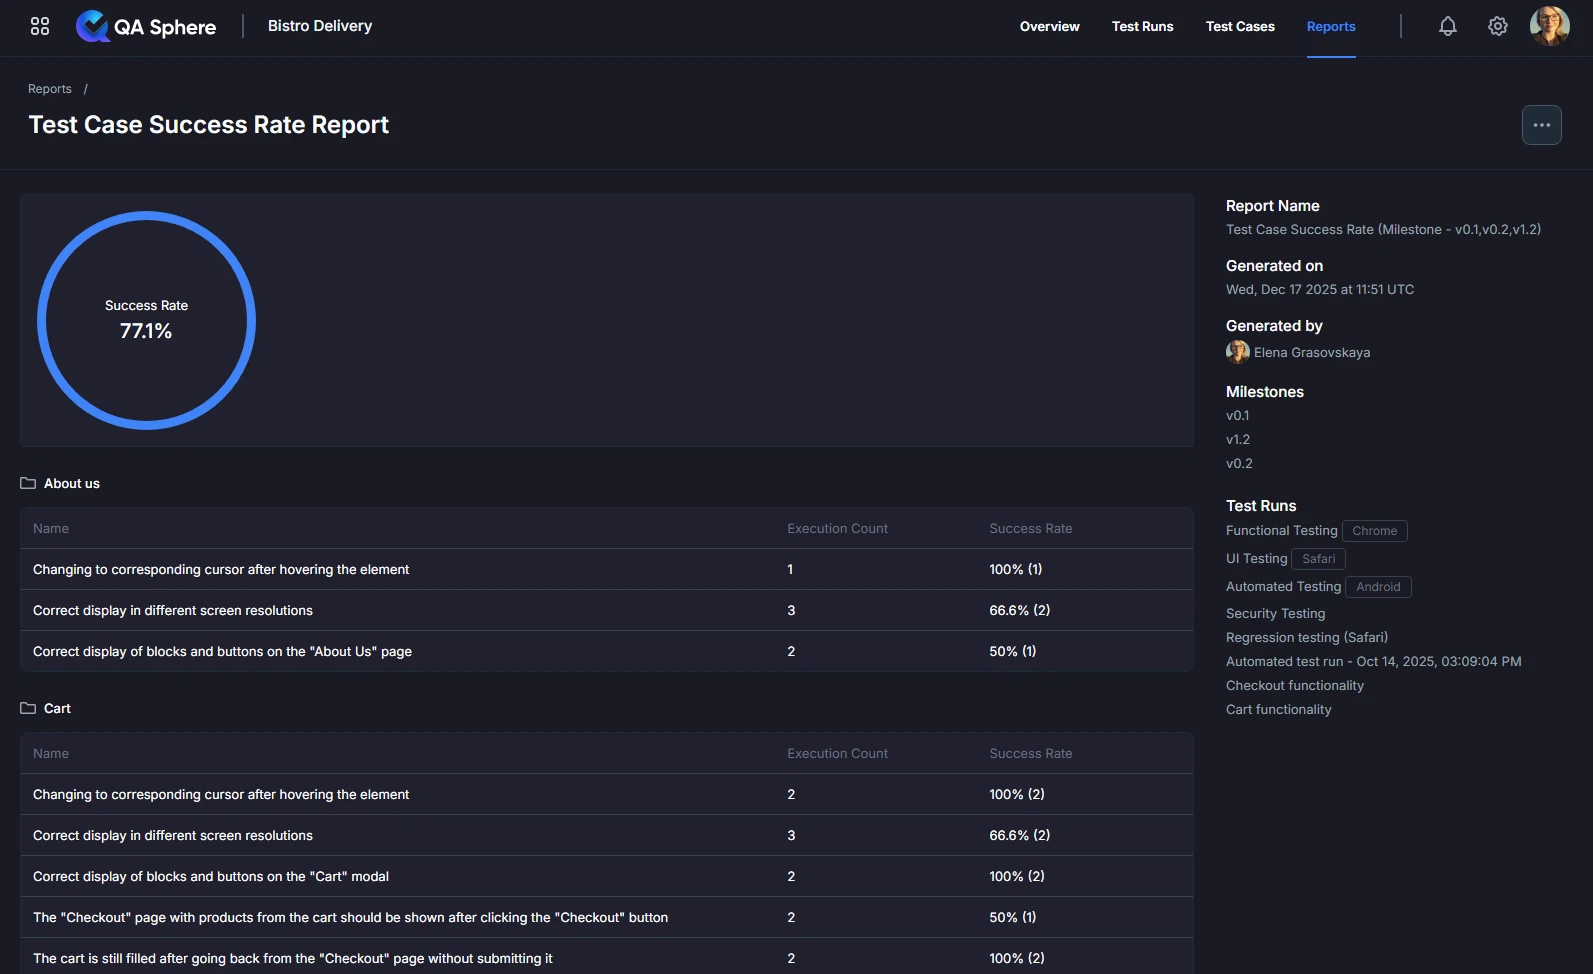
At the top of the report, you'll see the aggregate success rate displayed in a circular progress indicator showing the overall percentage of successful test executions.
Example:
Success Rate: 68.1%
Interpretation: Across all test executions, tests passed 68.1% of the time. This indicates room for improvement in test reliability.
Success Rate Table
The detailed table shows per-test metrics organized by folder structure:
| Column | Description |
|---|---|
| Name | Test case name and description |
| Execution Count | Number of times test has been executed |
| Success Rate | Percentage of executions that passed |
Success Rate Indicators:
- 90-100%: Reliable test ✅
- 70-89%: Acceptable but needs monitoring ⚠️
- 50-69%: Flaky test requiring attention ❌
- Below 50%: Broken test needing immediate fix 🚫
Generating the Report

- Open your QA Sphere project
- Click Reports in the top navigation
- Select Test Case Success Rate
- Click Next
- Choose the way to select test cases for the report: by Milestone, Test Run or time Period
- Click Build report
Export Options
Export XLSX:
- Raw data export for further analysis
- Open in Excel, Google Sheets, or BI tools
- Click ... and then Export XLSX button
Export PDF:
- Full report with charts and tables
- Professional formatting for stakeholder distribution
- Click ... and then Export PDF button
Print:
- Direct print for physical documentation
- Formatted for standard paper sizes
- Click ... and then Print button
Getting Help
For assistance with this report:
- Review the report parameters to ensure correct configuration
- Check the Reports Overview for general guidance
- Contact QA Sphere support: [email protected]
Quick Summary: Use the Test Case Success Rate report to identify unreliable tests. Target 95%+ success for critical tests, 90%+ for others. Investigate tests below 80% immediately. Track improvement over time and quarantine flaky tests from critical pipelines.