Effort by Team Member Report
The Effort by Team Member report analyzes the effort spent by individual team members on testing activities, providing insights into workload distribution, productivity, and resource utilization. This report helps identify bottlenecks, balance workloads, and plan resource allocation effectively.
What This Report Shows
The Effort by Team Member report displays:
- Total Effort per Team Member: Aggregate effort spent by each team member
- Test Cases Executed: Number of test cases executed by each team member
- Time Tracked: Total time spent on testing activities by each team member
- Issues Created: Number of bugs or issues reported by each team member
When to Use This Report
Use the Effort by Team Member report when you need to:
- Balance workloads across the testing team
- Identify resource bottlenecks where team members are overloaded
- Plan sprint capacity based on historical team member effort
- Track productivity and contribution of individual team members
- Justify resource needs with data on current team capacity and workload
- Conduct performance reviews with objective effort metrics
- Optimize team structure by understanding work distribution patterns
Understanding the Report
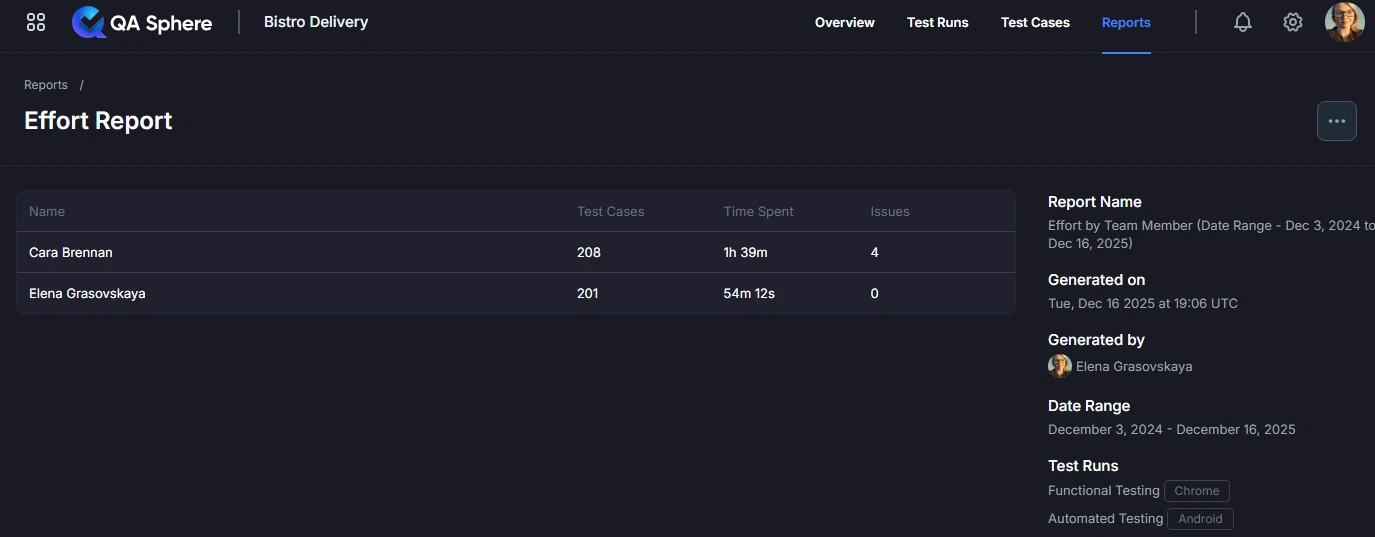
Team Member Effort Summary
The report displays a table or visualization showing effort metrics for each team member:
| Team Member | Test Cases Executed | Time Spent | Issues Created |
|---|---|---|---|
| Alice Smith | 45 | 32h 15m | 12 |
| Bob Johnson | 38 | 28h 45m | 8 |
| Carol Davis | 52 | 36h 30m | 15 |
| David Lee | 25 | 17h 20m | 5 |
Interpretation Example:
- Carol Davis has the highest workload (32% of total effort, 52 test cases)
- David Lee has the lowest workload (15% of total effort, 25 test cases)
- Workload distribution shows some imbalance that may need attention
Effort Metrics Explained
Test Cases Executed:
- Total number of test cases run by the team member
- Includes both manual and automated test execution
- Higher numbers indicate more test execution volume
Time Spent:
- Total time tracked for testing activities
- Includes test execution, bug investigation, and retesting logged by the team
- Measured in hours and minutes
Issues Created:
- Number of bugs, defects, or issues logged by the team member
- Indicates testing effectiveness (finding bugs)
- Should be considered alongside test cases executed
Generating the Report
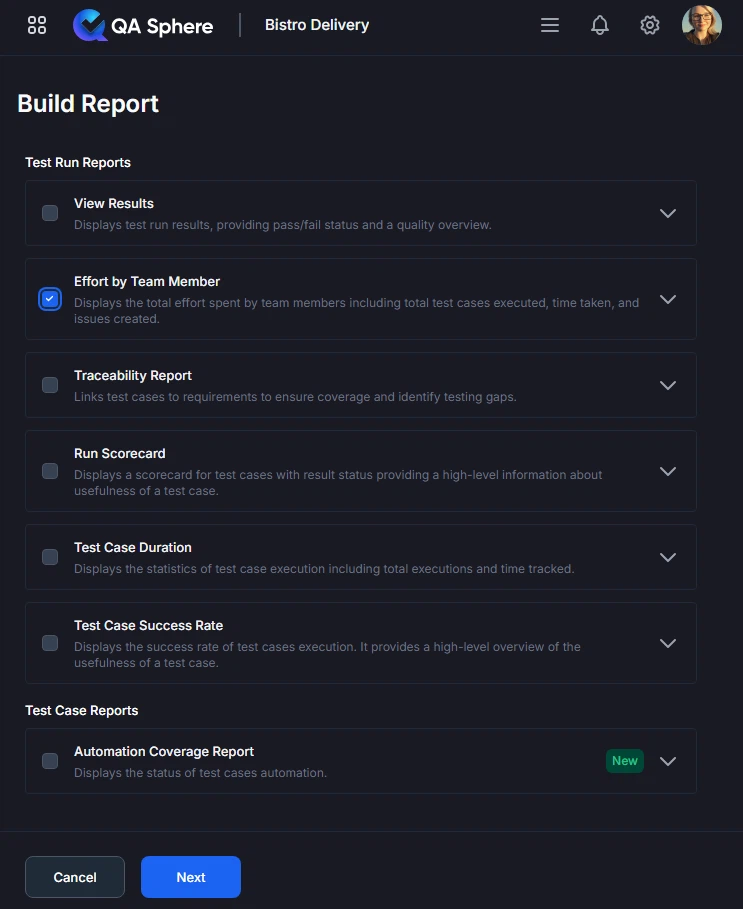
- Open your QA Sphere project
- Click Reports in the top navigation
- Select Effort by Team Member
- Click Next
- Choose the way to select test cases for the report: by Milestone, Test Run or time Period
- Click Build report
Export Options
Export XLSX:
- Raw data export for further analysis
- Open in Excel, Google Sheets, or BI tools
- Click ... and then Export XLSX button
Export PDF:
- Full report with charts and tables
- Professional formatting for stakeholder distribution
- Click ... and then Export PDF button
Print:
- Direct print for physical documentation
- Formatted for standard paper sizes
- Click ... and then Print button
Best Practices
1. Track Effort Consistently
Establish Standards:
- All team members track time in same way
- Use same categories for activities
- Track daily, not retrospectively
- Include all testing-related activities
What to Track:
- Test execution time
- Test creation time
- Bug investigation time
- Retesting time
- Test maintenance time
- Environment setup time
- Meetings and planning time (if applicable)
2. Set Realistic Capacity Targets
Consider Individual Factors:
- Experience level (junior vs senior)
- Specialization areas
- Part-time vs full-time
- Non-testing responsibilities
- Training and development time
Example Targets:
Senior QA (5+ years): 35-40h testing/week
Mid-level QA (2-5 years): 30-35h testing/week
Junior QA (<2 years): 25-30h testing/week

Note: Accounts for meetings, training, planning
3. Regular Workload Reviews
Review Cadence:
- Weekly: Quick check for severe imbalances
- Sprint: Comprehensive effort review
- Monthly: Long-term workload trends
- Quarterly: Capacity planning
Review Checklist:
- Workload distribution within 20% variance
- No team member consistently overloaded
- Junior team members getting appropriate work
- Specialized skills utilized effectively
- Team capacity aligned with project needs
4. Balance Efficiency with Quality
Don't Over-Optimize:
- High test case count ≠ High quality
- Finding fewer bugs may indicate good software, not poor testing
- Some tests legitimately take longer
- Training and mentoring reduces immediate output but builds capacity
Quality Indicators to Track:
- Bug escape rate (bugs found in production)
- Bug severity distribution
- Test coverage metrics
- Customer satisfaction
5. Use for Development, Not Punishment
Healthy Use:
- Identify training needs
- Balance workloads
- Recognize contributions
- Plan capacity
- Remove blockers
Unhealthy Use:
- Ranking team members
- Punitive measures for low numbers
- Ignoring context (complexity, blockers)
- Creating competition vs collaboration
6. Consider Context Always
Factors Affecting Effort:
- Test complexity (API vs UI vs manual)
- Learning curve (new features, new tools)
- Environment issues and blockers
- Unplanned work and interruptions
- Cross-functional collaboration time
Example Context:
Bob: 20 test cases in 40 hours
Reason: Working on complex security testing requiring deep investigation
Action: Recognize expertise, not penalize low count

Alice: 80 test cases in 40 hours
Reason: Automated smoke tests, quick execution
Action: Recognize efficiency, but ensure depth of testing
Troubleshooting
Issue: Effort Data Missing or Incomplete
Symptoms: Some team members show no effort data
Possible Causes:
- Time tracking not enabled
- Team members not logging time
- Date range excludes their work
- Permissions issue
Solutions:
- Ensure time tracking is enabled in project settings
- Train team on time tracking process
- Verify date range includes their activity period
- Check user permissions allow time tracking
Issue: Effort Numbers Seem Inaccurate
Symptoms: Reported effort doesn't match expected workload
Possible Causes:
- Inconsistent time tracking practices
- Activities not categorized correctly
- Includes/excludes non-testing time incorrectly
Solutions:
- Standardize time tracking across team
- Review activity categorization guidelines
- Clarify what should/shouldn't be tracked
- Audit sample of time entries for accuracy
Issue: Can't Compare Team Members Fairly
Symptoms: Metrics vary too much due to different work types
Possible Causes:
- Team members work on different test types
- Different specializations and complexity
- Part-time vs full-time team members
Solutions:
- Normalize by FTE (full-time equivalent)
- Group by work type for fair comparison
- Consider complexity weighting
- Compare trends over time, not absolute numbers
Related Reports
- View Results: See what effort produced in terms of test results
- Test Case Duration: Understand time requirements of specific tests
- Test Runs Scorecard: Compare test run outcomes by team member
Getting Help
For assistance with this report:
- Verify time tracking is configured and enabled
- Check the Reports Overview for general guidance
- Review team time tracking practices
- Contact QA Sphere support: [email protected]
Quick Summary: The Effort by Team Member report helps you understand workload distribution and team productivity. Use it for sprint planning, workload balancing, and identifying resource needs. Track effort consistently, set realistic targets, and always consider context when interpreting metrics. Use for development and planning, not for punitive measures.