Test Runs Scorecard Report
The Test Runs Scorecard report provides a comparative analysis of multiple test runs, enabling you to understand testing efficiency, identify configuration-specific issues, and track quality trends across different environments, browsers, or time periods.
What This Report Shows
The Test Runs Scorecard displays:
- Aggregate Status Metrics: Overall status distribution across all selected test runs
- Test Run Comparison Table: Side-by-side comparison of test run performance
- Configuration Analysis: Performance breakdown by browser, environment, or configuration
- Trend Identification: Patterns across multiple test executions
- Statistical Summary: Total, passed, failed, and skipped counts per test run
When to Use This Report
Use the Test Runs Scorecard when you need to:
- Compare test performance across different configurations (browsers, environments)
- Identify configuration-specific issues (Safari failures vs Chrome successes)
- Track quality trends over multiple test runs or sprints
- Analyze testing efficiency across different test suites
- Verify environment parity (staging vs production)
- Evaluate sprint improvements by comparing sprint-over-sprint performance
Understanding the Report
Aggregate Status Visualization
At the top of the report, you'll see an overall status breakdown across all selected test runs:
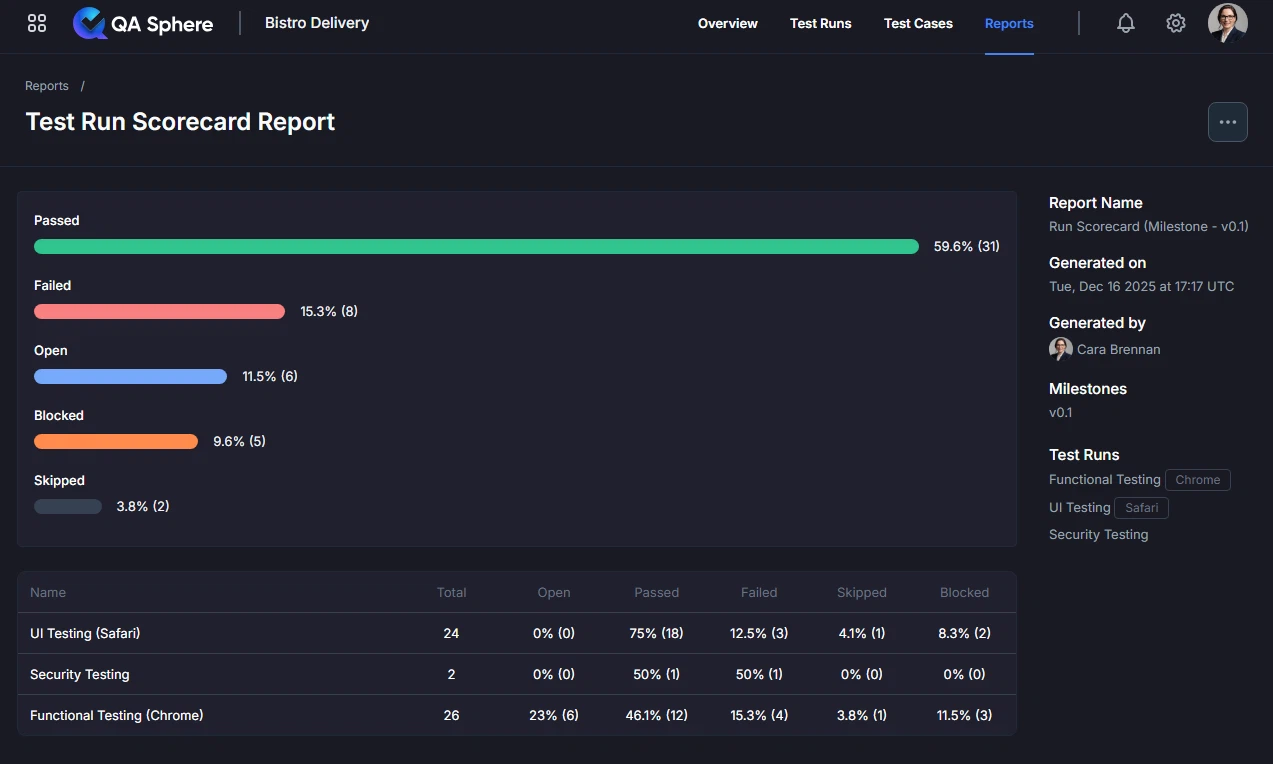
Status Summary Shows:
- Passed (Green): Overall percentage and count of successful tests
- Failed (Red): Overall percentage and count of failed tests
- Open (Blue): Overall percentage and count of unexecuted tests
- Blocked (Orange): Overall percentage and count of blocked tests
- Skipped (Gray): Overall percentage and count of skipped tests
How to Read the Aggregate:
- These are combined metrics from all selected test runs
- If a test case passed in one run and failed in another, both results are counted
- Use this for high-level understanding before drilling into specifics
Test Run Comparison Table
Below the visualization, you'll find a detailed comparison table:
| Column | Description |
|---|---|
| Name | Test run name with configuration info |
| Total | Total number of test cases in this run |
| Open | Percentage and count of unexecuted tests |
| Passed | Percentage and count of successful tests |
| Failed | Percentage and count of failed tests |
| Skipped | Percentage and count of skipped tests |
| Blocked | Percentage and count of blocked tests |
Example Table:
Name                         Total  Open      Passed     Failed     Skipped    Blocked
UI Testing (Safari)          24     0% (0)    75% (18)   12.5% (3)  4.1% (1)   8.3% (2)
Functional Testing (Chrome)  26     23% (6)   46.1% (12) 15.3% (4)  3.8% (1)   11.5% (3)
Key Insights from Example:
- Safari run has better execution coverage (0% Open vs Chrome's 23% Open)
- Chrome has lower pass rate (46.1% vs Safari's 75%)
- Both configurations have blocked tests that need attention
Generating the Report
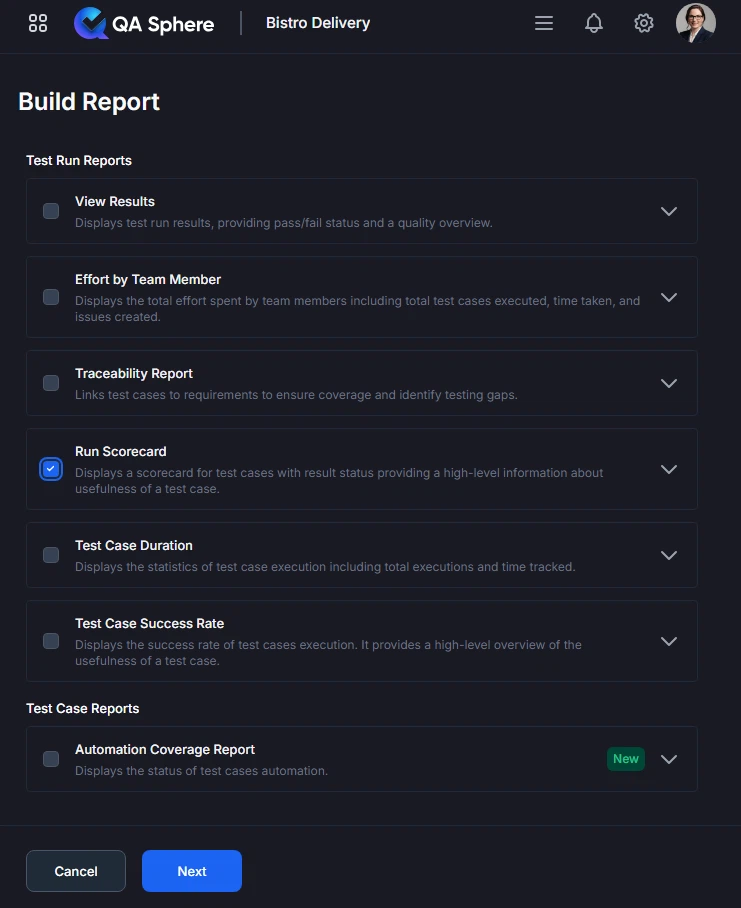
- Open your QA Sphere project
- Click Reports in the top navigation
- Select Run Scorecard
- Click Next
- Choose the way to select test cases for the report: by Milestone, Test Run or time Period
- Click Build report
Export Options
Export XLSX:
- Raw data export for further analysis
- Open in Excel, Google Sheets, or BI tools
- Click ... and then Export XLSX button
Export PDF:
- Full report with charts and tables
- Professional formatting for stakeholder distribution
- Click ... and then Export PDF button
Print:
- Direct print for physical documentation
- Formatted for standard paper sizes
- Click ... and then Print button
Interpreting Results
Cross-Browser Performance
Healthy Pattern:
Chrome:  Total 50, Passed 90%, Failed 8%,  Open 2%
Firefox: Total 50, Passed 88%, Failed 10%, Open 2%
Safari:  Total 50, Passed 85%, Failed 12%, Open 3%
Interpretation: Consistent performance across browsers with minor variations expected.
Problem Pattern:
Chrome:  Total 50, Passed 90%, Failed 8%,  Open 2%
Firefox: Total 50, Passed 88%, Failed 10%, Open 2%
Safari:  Total 50, Passed 60%, Failed 35%, Open 5%  ← Major issue!
Interpretation: Safari-specific failures require immediate investigation. Tests that pass on Chrome/Firefox are failing on Safari.
Action Items:
- Review Safari-specific test failures
- Check for browser compatibility issues
- Update WebDriver or test framework
- Consider CSS/JavaScript compatibility
Environment Parity
Healthy Pattern:
Staging:    Total 100, Passed 95%, Failed 5%
Production: Total 100, Passed 93%, Failed 7%
Interpretation: Minor difference is acceptable - production may have additional edge cases.
Problem Pattern:
Staging:    Total 100, Passed 95%, Failed 5%
Production: Total 100, Passed 70%, Failed 30%  ← Critical issue!
Interpretation: Production environment has significant issues not present in staging.
Action Items:
- Verify environment configurations match
- Check for production-specific data issues
- Review deployment process
- Investigate infrastructure differences
Sprint-over-Sprint Trends
Improving Trend (Good):
Sprint 23: Total 80, Passed 75%, Failed 20%, Blocked 5%
Sprint 24: Total 85, Passed 82%, Failed 13%, Blocked 5%
Sprint 25: Total 90, Passed 88%, Failed 9%,  Blocked 3%
Interpretation: Quality is improving - higher pass rates, fewer failures, fewer blocked tests.
Declining Trend (Bad):
Sprint 23: Total 80, Passed 88%, Failed 10%, Blocked 2%
Sprint 24: Total 80, Passed 82%, Failed 15%, Blocked 3%
Sprint 25: Total 80, Passed 75%, Failed 20%, Blocked 5%  ← Declining!
Interpretation: Quality is degrading - increasing failures and blocked tests indicate accumulating technical debt or insufficient test maintenance.
Action Items:
- Review test case reliability
- Prioritize bug fixes
- Allocate time for test maintenance
- Address root causes of failures
Execution Coverage
Complete Execution:
Test Run A: Total 100, Open 0%,  Passed 85%, Failed 15%
Test Run B: Total 100, Open 0%,  Passed 87%, Failed 13%
Test Run C: Total 100, Open 0%,  Passed 84%, Failed 16%
Interpretation: All test runs executed completely - good coverage.
Incomplete Execution:
Test Run A: Total 100, Open 0%,  Passed 85%, Failed 15%
Test Run B: Total 100, Open 25%, Passed 60%, Failed 15%  ← Incomplete!
Test Run C: Total 100, Open 30%, Passed 55%, Failed 15%  ← Incomplete!
Interpretation: Some test runs didn't execute all test cases - gaps in coverage.
Action Items:
- Identify why tests weren't executed
- Check for time constraints
- Review test selection criteria
- Allocate more resources if needed
Common Use Cases
Use Case 1: Cross-Browser Validation
Scenario: QA team needs to verify application works across all supported browsers
Steps:
- Execute test suite on Chrome, Firefox, and Safari
- Generate scorecard comparing all three test runs
- Identify browser-specific failures
- Prioritize fixes based on browser market share
Report Configuration:
- Test Runs: Latest test runs for each browser
- Comparison: Side-by-side browser results
Expected Outcome:
- Pass rates within 5% across browsers
- Browser-specific failures documented
- Action plan for compatibility fixes
Real Example:
Chrome (60% market share):  Passed 92%, Failed 8%  ✓ Good
Firefox (5% market share):  Passed 89%, Failed 11% ✓ Acceptable
Safari (20% market share):  Passed 75%, Failed 25% ✗ Must fix!
Edge (10% market share):    Passed 88%, Failed 12% ✓ Acceptable
Action: Prioritize Safari fixes due to high market share and high failure rate.
Use Case 2: Sprint Retrospective
Scenario: Team reviews testing quality and efficiency during sprint retrospective
Steps:
- Generate scorecard for last 3 sprints
- Compare pass rates and failure trends
- Discuss improvements or regressions
- Set goals for next sprint
Report Configuration:
- Test Runs: One regression run per sprint
- Comparison: Sprint-over-sprint trends
Discussion Points:
- "Why did our pass rate drop from 90% to 80%?"
- "Blocked tests increased - what's causing this?"
- "We reduced failures from 15% to 8% - what did we do right?"
Outcome: Data-driven retrospective with clear quality metrics and improvement goals.
Use Case 3: Release Qualification
Scenario: Release manager needs to verify application is ready for production deployment
Steps:
- Execute test suite in staging environment
- Deploy to production
- Execute same test suite in production
- Generate scorecard comparing staging vs production
- Make go/no-go decision
Report Configuration:
- Test Runs: Staging run and Production run
- Comparison: Environment parity check
Go Criteria:
- ✅ Production pass rate within 5% of staging
- ✅ No new failures in production
- ✅ Critical paths passing in production
- ✅ No blocked tests in production
Example Decision:
Staging:    Passed 95%, Failed 5%
Production: Passed 94%, Failed 6%  ✓ GO - Within tolerance
Use Case 4: CI/CD Pipeline Optimization
Scenario: DevOps team wants to optimize test execution across pipeline stages
Steps:
- Compare test runs from different pipeline stages
- Identify redundant test execution
- Analyze failure patterns by stage
- Optimize test distribution
Report Configuration:
- Test Runs: Smoke tests, Unit tests, Integration tests, E2E tests
- Comparison: Execution efficiency by stage
Optimization Insights:
Smoke Tests:       Total 20,  Duration 5min,  Passed 95%  ✓ Fast & reliable
Unit Tests:        Total 500, Duration 10min, Passed 98%  ✓ Fast & reliable
Integration Tests: Total 100, Duration 30min, Passed 85%  ~ Needs improvement
E2E Tests:         Total 50,  Duration 60min, Passed 70%  ✗ Slow & unreliable
Actions:
- Invest in fixing unreliable E2E tests
- Parallelize integration tests
- Move some E2E tests to integration layer
Best Practices
1. Compare Apples to Apples
Good Comparisons:
- Same test suite, different browsers
- Same test suite, different environments
- Same test suite, different time periods
Poor Comparisons:
- Different test suites (smoke vs full regression)
- Different application versions (v1.0 vs v2.0)
- Different test data sets
Why It Matters: Valid comparisons require consistent test scope.
2. Use Consistent Naming
Name test runs to clearly indicate their purpose:
Good Names:
- "Sprint 24 - Chrome - Full Regression"
- "Release 2.5 - Staging - Smoke Tests"
- "Feature ABC - Integration Tests"
Poor Names:
- "Test Run 42"
- "Friday tests"
- "Bob's run"
Why It Matters: Clear names make the scorecard immediately understandable.
3. Set Baseline Metrics
Before tracking trends, establish baselines:
Baseline Metrics to Track:
- Average pass rate: __%
- Average execution time: __ minutes
- Average test count: __
- Typical failure rate: __%
How to Use:
- Compare future runs against baseline
- Identify significant deviations
- Track long-term trends
Example:
Baseline (Sprint 20): Passed 85%, Failed 12%, Blocked 3%
Current  (Sprint 25): Passed 90%, Failed 8%,  Blocked 2%
Trend: Improving! Pass rate +5%, Failures -4%, Blocked -1%
4. Look for Patterns
Don't focus on single data points - identify patterns:
Pattern Types:
- Consistent failures: Same test failing across all runs
- Configuration-specific: Failures only on specific browsers/environments
- Time-based: Failures increasing over time
- Intermittent: Test passing some runs, failing others
Example Pattern Analysis:
Test: "User Login"
Chrome:  Pass Pass Pass Pass Pass  ✓ Stable
Firefox: Pass Pass Pass Pass Pass  ✓ Stable
Safari:  Pass Fail Pass Fail Pass  ⚠ Flaky!
Action: Investigate Safari-specific flakiness - timing issue or browser bug?
5. Act on Outliers
When one test run shows significantly different results:
Outlier Example:
Run 1: Passed 90%, Failed 10%
Run 2: Passed 88%, Failed 12%
Run 3: Passed 50%, Failed 50%  ← Outlier!
Run 4: Passed 89%, Failed 11%
Investigation Steps:
- Was test data corrupted?
- Was environment unstable?
- Was a different version tested?
- Did test suite change?
Don't Ignore: Outliers often reveal important issues.
6. Share with Stakeholders
Different audiences need different views:
For Developers:
- Browser-specific failures
- Environment parity issues
- Test reliability trends
For QA Managers:
- Sprint-over-sprint improvements
- Resource allocation efficiency
- Testing bottlenecks
For Product Managers:
- Release readiness comparison
- Feature coverage by configuration
- Risk assessment
For Executives:
- High-level pass rate trends
- Quality improvement metrics
- Release confidence scores
7. Regular Scorecard Reviews
Recommended Cadence:
- Weekly: Compare last 2 weeks
- Sprint End: Compare last 3 sprints
- Monthly: Compare monthly trends
- Release: Compare staging vs production
Benefits:
- Early detection of quality regressions
- Continuous improvement tracking
- Team accountability for quality
Related Reports
- Test Cases Results Overview: Detailed view of individual test case results
- Test Case Success Rate Analysis: Identify unreliable tests across multiple runs
- Test Case Duration Analysis: Compare execution times across test runs
- Testing Effort Analysis: Compare time spent across different test runs
Getting Help
For assistance with this report:
- Review the report parameters to ensure correct test run selection
- Check the Reports Overview for general guidance
- Verify test runs executed successfully before comparing
- Contact QA Sphere support: [email protected]
Quick Summary: The Test Runs Scorecard is your tool for comparative analysis. Use it to compare browsers, environments, or time periods. Look for patterns, not just individual numbers. Act quickly on outliers and regressions. Regular scorecard reviews drive continuous quality improvement.