Test Cases Results Overview Report
The Test Cases Results Overview report provides a comprehensive snapshot of test case execution results across selected test runs. The report shows the latest result for each test case - when you include one or multiple test runs, each test case appears once with its most recent execution status. This gives you an overall view of your current testing efforts and helps you understand the current state of your test suite, not historical trends.
What This Report Shows
The Test Cases Results Overview displays:
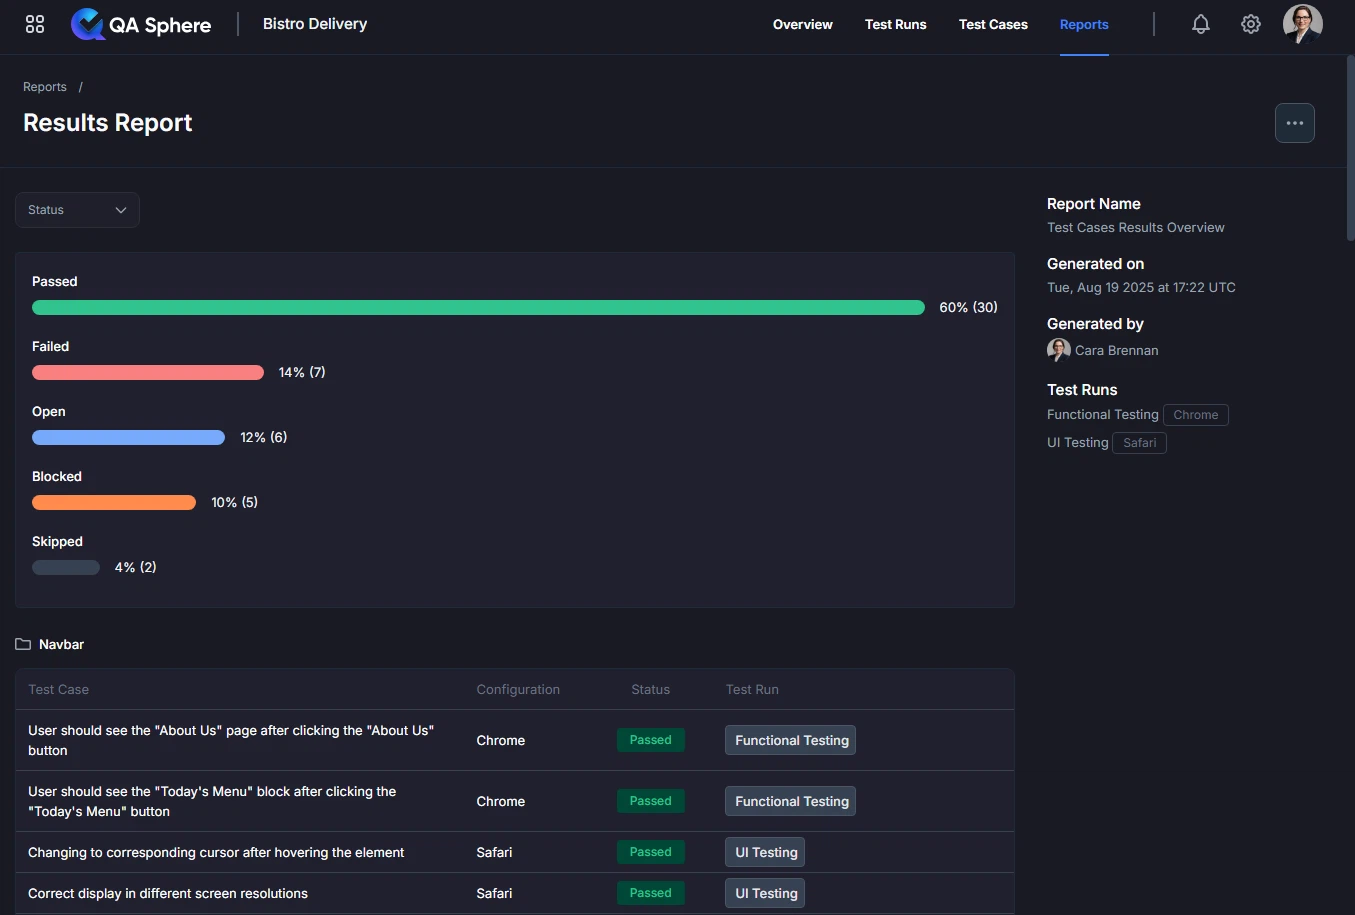
- Overall Status Distribution: Visual breakdown of test results by status (Passed, Failed, Open, Blocked, Skipped)
- Test Case Details: Complete list of test cases with their latest execution results across selected test runs
- Configuration Information: Test configuration details (browser, environment, etc.)
- Test Run Assignments: Which test run each result belongs to (the most recent run for each test case)
- Folder Organization: Test cases grouped by their folder structure
Latest Result Per Test Case: When you include multiple test runs in the report, each test case appears only once showing its most recent execution result. For example, if "Login Test" was run in Test Run A (Passed) and Test Run B (Failed), the report shows only the Failed status from Test Run B. This provides a current-state snapshot of your testing efforts rather than historical data.
When to Use This Report
Use the Test Cases Results Overview when you need to:
- Check current testing status during daily standups or status meetings
- Identify failing test cases that need immediate attention
- Review test coverage across different test folders
- Prepare for release by verifying test execution status
- Communicate results to stakeholders with clear visualizations
- Track progress during a testing cycle or sprint
Understanding the Report
Status Visualization
At the top of the report, you'll see a visual breakdown of test case statuses:

Status Bars Show:
- Passed (Green): Percentage and count of successful tests
- Failed (Red): Percentage and count of failed tests
- Open (Blue): Percentage and count of unexecuted tests
- Blocked (Orange): Percentage and count of blocked tests
- Skipped (Gray): Percentage and count of skipped tests
How to Read the Visualization:
- Longer bars indicate higher percentages
- Numbers show both percentage and absolute count
- Color coding provides instant visual recognition
- Aim for high green (Passed) percentages
Test Case Table
Below the visualization, you'll find a detailed table with:
| Column | Description |
|---|---|
| Test Case | Name and description of the test case |
| Configuration | Test configuration (browser, OS, environment) |
| Status | Latest execution status (badge with color coding) - shows the most recent result if the test case was executed in multiple runs |
| Test Run | Which test run this result belongs to (the most recent run where this test case was executed) |
Status Badges:
- Passed - Green badge, test executed successfully
- Failed - Red badge, test failed one or more assertions
- Open - Blue badge, test not yet executed
- Blocked - Orange badge, test blocked by dependency or issue
- Skipped - Gray badge, test intentionally skipped
Folder Organization
Test cases are organized by their folder structure in QA Sphere:
📁 Navbar
  └─ Test Case 1
  └─ Test Case 2
📁 About us
  └─ Test Case 3
📁 Menu
  └─ Test Case 4
  └─ Test Case 5
Generating the Report

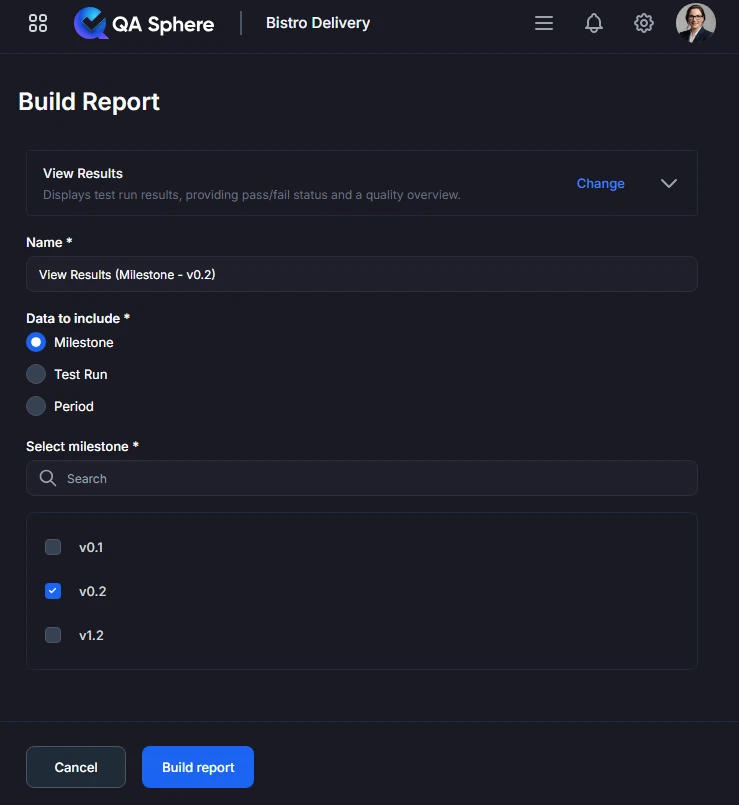
- Open your QA Sphere project
- Click Reports in the top navigation
- Select View Results
- Click Next
- Choose the way to select test cases for the report: by Milestone, Test Run or time Period
- Click Build report
Export Options
Export XLSX:
- Raw data export for further analysis
- Open in Excel, Google Sheets, or BI tools
- Click ... and then Export XLSX button
Export PDF:
- Full report with charts and tables
- Professional formatting for stakeholder distribution
- Click ... and then Export PDF button
Print:
- Direct print for physical documentation
- Formatted for standard paper sizes
- Click ... and then Print button
Best Practices
1. Regular Report Reviews
Establish a Cadence:
- Daily: Generate report each morning to track overnight test runs
- Sprint Reviews: Generate at sprint end for retrospectives
- Release Gates: Generate before each release decision
Benefits:
- Early detection of quality issues
- Consistent quality tracking
- Data-driven decision making
2. Use Meaningful Test Run Names
When creating test runs in QA Sphere, use descriptive names:
Good Examples:
- "Sprint 23 - Chrome - Regression Suite"
- "Release 2.5 - Cross-Browser - Smoke Tests"
- "Feature ABC - Integration Tests"
Poor Examples:
- "Test Run 1"
- "Monday tests"
- "Run 123"
Why This Matters: Clear test run names make the report immediately understandable.
3. Export for Documentation
PDF Exports for:
- Release documentation
- Audit trails
- Stakeholder reports
XLSX Exports for:
- Trend analysis in Excel
- Integration with BI tools
- Custom reporting
4. Combine with Other Reports
Use multiple reports together for complete picture:
Test Cases Results Overview + Test Traceability Matrix:
- Verify all requirements are tested
- Check requirement coverage status
Test Cases Results Overview + Test Case Success Rate:
- Identify consistently failing tests
- Prioritize test maintenance
Test Cases Results Overview + Test Case Duration:
- Optimize slow tests
- Improve CI/CD performance
Getting Help
For assistance with this report:
- Review the report parameters to ensure correct configuration
- Check the Reports Overview for general guidance
- Contact QA Sphere support: [email protected]
Quick Summary: The Test Cases Results Overview report shows the latest result for each test case across one or multiple test runs, giving you an overall view of your current testing efforts. Use it daily for quick status checks, before releases for readiness verification, and during sprints for progress tracking. Focus on maintaining a high pass rate and quickly addressing failures and blocked tests.